Back in September, I told you about our experiment to see who our most loyal newsletter readers were. I thought that was a better measure of email engagement than simply looking at open or click rates. Here’s what we discovered:
We used our CRM to help us figure this out, but I knew there had to be a way to do it in Excel too, so I put out the call for help.
Two of your peers heard the call, and came up with solutions. Thank you Karin Flom of the Student Press Law Center and Heidi Pickman of CAMEO!
Karin and Heidi use two different approaches, and both require that you have some Excel skills. But either way works if you want to replicate the analysis I did using Excel.
OPTION #1: Use the Excel Template Heidi Built
You can download the Excel template Heidi built here and follow the instructions inside.
OPTION #2: Use a Pivot Table Following Karin’s Instructions
Karin provided the following instructions, starting with MailChimp (but you can use anything that allows you to export lists).
1) MailChimp allows you to go to the email report and view all sorts of data about the email: who did you send to, who opened, who clicked, who didn’t open, etc. When you click those specifics in the report, you have the option to export them with one click as a CSV.
2) I exported “subscribers who opened” from our last four weekly emails. I quickly cut and paste those emails into one column in a new Excel workbook.
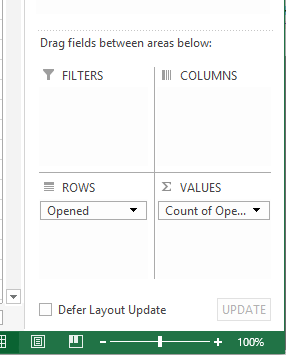
3) By creating a pivot table and putting Column A “Opens” into the “Rows” and “Values” sections, Excel will tell you how many times each unique value appears in your data. In this case, I had 690 people open at least one of the four emails.

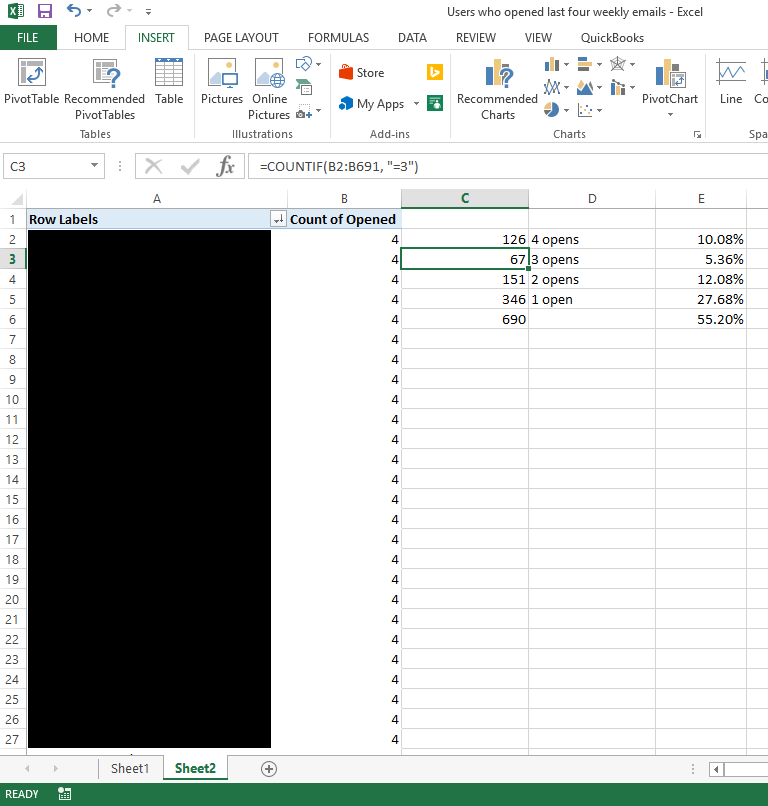
4) Go to a fresh cell on your pivot table sheet and use the “COUNTIF” function. For example, in my pivot table sheet, column B was the count of how many emails a subscriber had opened (values ranging from 1-4). Your formula should look like this, with the # replacing your row numbers of your data and changing the 4 to a 3 to count the number of people who opened 3 of 4 emails, etc. (The quotation marks are necessary in the formula).
=COUNTIF(B#:B#, “=4”)
5) Based on an average of 1250 users, here are my results:
| 126 | (4 opens) | 10.08% |
| 67 | (3 opens) | 5.36% |
| 151 | (2 opens) | 12.08% |
| 346 | (1 open) | 27.68% |
| 690 (total 1+ opens over 4 emails) | 55.20% |

I would say this took about 20 minutes, but I was going slow and trying to figure it out. Going forward as a monthly metric mechanism, I would say it would only take me about 10 minutes. Definitely worth it for this extra insight.
BONUS: I can copy and paste the emails from the pivot table for “highly engaged” subscribers and create a pasted segment in MailChimp if I ever want to email these folks directly.
Thank you Heidi and Karin!![]()


