Spring is here, and with it, the 11th Annual M+R Benchmarks Study.
The 11th edition has a central theme – everything in nonprofit digital has accelerated. So this year’s benchmarks include more data from more supporter contacts in more media from more participating nonprofits in more sectors than ever before. Websites. Fundraising. Email. Advertising. Social media.
One thing I was glad to see explored — the impact of the election on digital engagement, especially fundraising. Would nonprofits that engage in electoral work have an easier time connecting with supporters, with apolitical nonprofits struggling?
Short answer: nope! Read the report for more.
The website also has a nifty “Benchmark Yourself” tool to help you compare (and then download) your results vs the M+R Benchmarks.
Let’s dive into the data.
FUNDRAISING

- Overall online revenue increased by 14% in 2016, on par with the 15 percent growth measured in 2015.
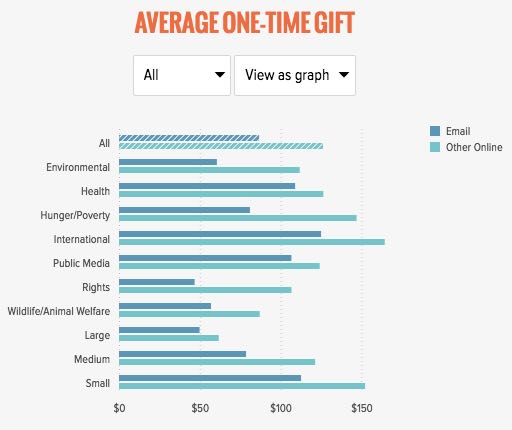
- Revenue from monthly giving grew by 23%, compared to 13 percent growth for one-time giving. Monthly giving accounted for 16% of all online revenue in 2016.
- Email messaging accounted for 26% of all online revenue, a 15% increase.

- Nonprofits sent more email in 2016 than in 2015: a 10% increase in messages per year per subscriber.
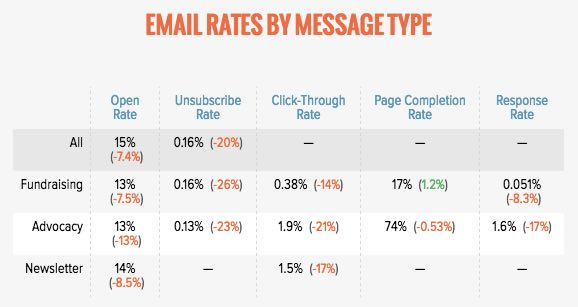
- Response rates for advocacy email declined, dropping 17% from 2015 levels.
- Fundraising email response rates experienced a small decline, dropping 8%.
WEB ENGAGEMENT

- Website visitors per month increased 3.6%.
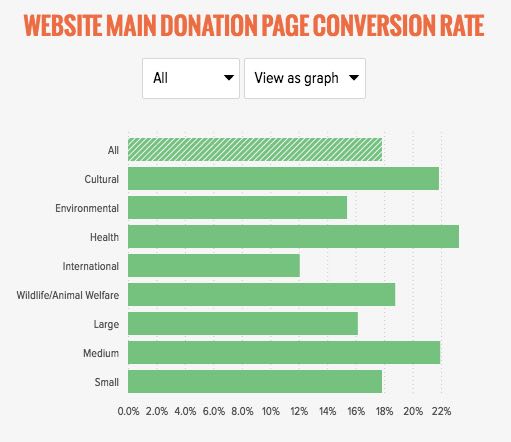
- On average, 1.2% of website visitors made a donation — an 8.3% increase from 2015.
- Nonprofits raised $1.19 per website visitor in 2016.
SOCIAL MEDIA

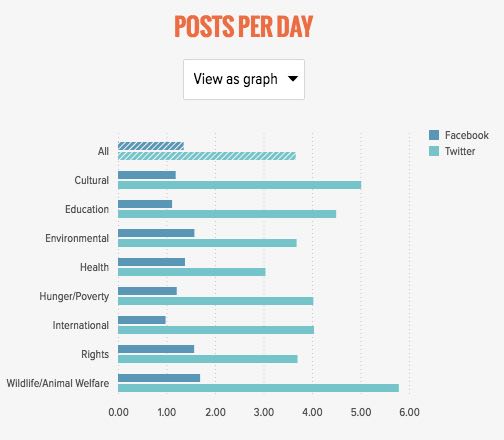
- For every 1,000 email subscribers, the average organization has 428 Facebook fans, 141 Twitter followers, and 39 Instagram followers.
- Facebook engagement was substantially higher than Twitter engagement. On Facebook, 4.6% of users who saw a post engaged in some way, while only 1.3% of Twitter audiences did the same.
- Just 8% of a nonprofit’s Facebook fans viewed an average post.
P.S. M+R is looking for public media organizations to take part in this study for next year. See the website for more info.
What struck you? Share your responses – and better yet, what you’ll DO about them – in the Comments.


