Right now, I bet most of you are looking at your open rates and click-through rates, and maybe your click-to-open ratio. The email service providers spoon feed us those numbers, so they are easy to track.
But they don’t really tell us much about the real percentage of people who care about our content.
For example, at Nonprofit Marketing Guide, we send an email newsletter every Wednesday. The open rate is hovering around 22%.
But that doesn’t mean the same 22% of people are opening it every single week. So it’s not really a good measure of overall engagement.
For me, if you open half of our newsletters, I’m happy. If you open 3 out of 4, or 4 out of 4, I’m thrilled. But I had no clue how many people that really represented. So I decided to find out by analyzing four newsletters in August.
Methodology – How I Did It
I started by going back to the email reports for the e-newsletters we sent on August 3, 10, 17, and 24. In Infusionsoft (the CRM we use), I can open a list of everyone who was sent the email, who opened it, and who clicked it and then apply tags to the people on those lists. So for example, if you were sent an email on August 3, you opened, and you clicked on it, I added these three tags to your record:
- 080316 – Sent
- 080316 – Opened
- 080316 – Clicked
If you were sent that August 3 edition, but you didn’t open or click on it, you would just get that first “Sent” tag. I had to do this by hand since I was going backward in time, but in the future, I can automate this tagging.
With all the tagging done, I could now break down the list.
The actual number of people who get the newsletter in any given week varies as people come on and off the list. So for this analysis, I only looked at people who received all 4 newsletters. That was 22,720 people.
First, I searched for people who received all 4 newsletters (had all 4 Sent tags for the 4 dates), and also had all 4 Open tags for those same dates. Then I did the opposite, and searched for people who had all 4 Sent tags, but none of the Open tags. Those were the easy ones.
Then it got more complicated. But by using the “with all” and “without any” searching features, I was able to do it fairly quickly. In total, here are the number of searches I had to run:
- Received All Four
- Received All Four, Opened All Four
- Received All Four, Opened None
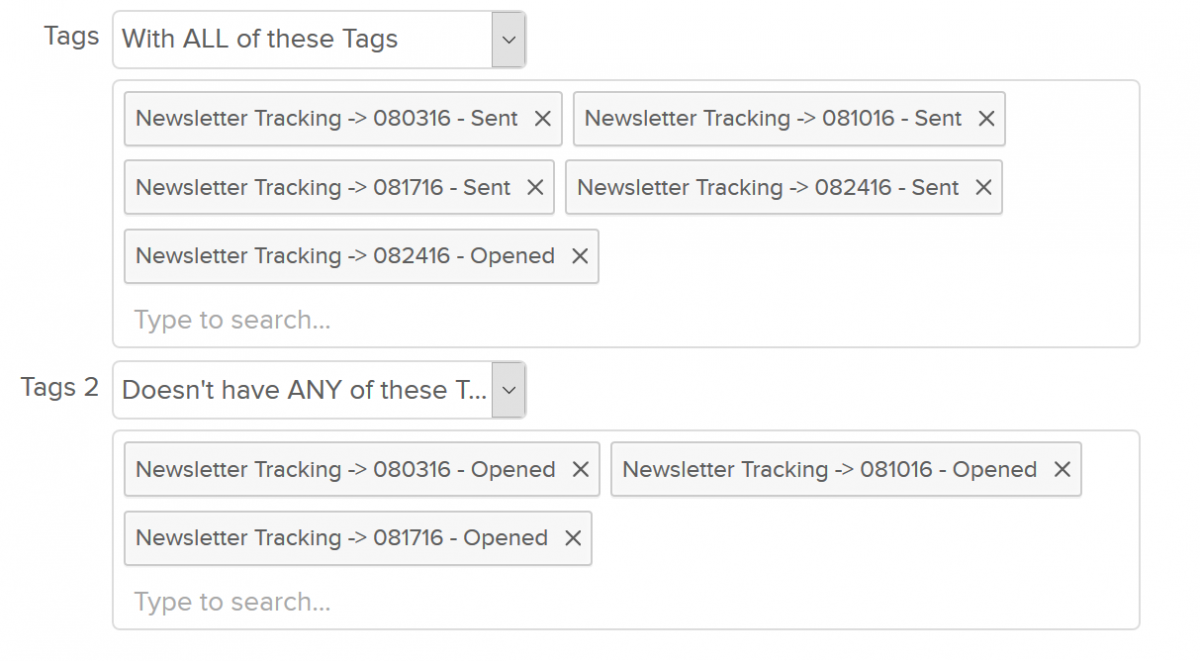
- Received All Four, Opened One (Four combinations, including the screen capture below)
- Received All Four, Opened Two (Six combinations)
- Received All Four, Opened Three (Four combinations)

This search produces a list of people who received all four newsletters, but who only opened the August 24 edition, and not the editions on August 3, 10, or 17.
Where I had multiple combinations, I totaled all the people within that grouping (ie everyone who opened just one newsletter, regardless of which date).
For those of you without this kind of searching and tagging ability, I bet there is some way to do this with Excel. But I personally wouldn’t know how to do it. If you do, let me know!
Our Email Engagement Rate: 38%
Here are the results. In honor of the start of football season (Go Panthers, #keeppounding), I’m going with a sports analogy for these different levels. But because this is really about long-term relationships, I’m also going with a friends and family metaphor. You pick which you like best.
The Die-Hard Fans: 8.5%
They opened all four newsletters. In August! I could kiss and hug you 1,932 people! We are FAMILY.
The Boosters: 6.6%
They opened three of the four newsletters. Again, in August. Super solid. High-fives to those 1,494 people. We are BFFs.
The Regulars: 8.2%
They opened half of the newsletters. Still very respectable. More than happy to share my peanuts and popcorn with these 1,865 people. We are FRIENDS.
The Fair-Weather Fans: 14.6%
They opened one out of four newsletters. Hey, I get it. It’s August! You are busy. I know, it’s fine. Unless I’m really interesting and relevant right now, you’ll take a pass. We may or may not wave when we see each other at the game. It’s cool. We are FACEBOOK FRIENDS.
On the Bandwagon: 62.1%
Zilch for opens in August for 14,114 people. Probably got on the list for one certain webinar or download, but actually don’t care that much about the content, or don’t find it that relevant or helpful, or are just too busy to bother. Again, it’s fine — for now. At some point, if we don’t see opens, we will purge them from the list. We are ACQUAINTENANCES.
A New Email Metric to Track: 23% Are “Our People”
Remember that 22% average open rate? If I include anyone who opened at least one of the four emails, which is how many people would define an “Engagement Rate,” that adds up to 38% of our newsletter mailing list.
But personally, I would rather draw the line at “opens half the time or more.” That’s the first three groups above or 23% of the list. For lack of a better term, I am calling this group “Our People.” We get each other. You could also call them “Highly Engaged.”
What to Do with This Information
So now what? One strategy would be to focus on the Fair-Weather and Bandwagon people to get them more engaged. And we might do a little bit of that.
But I am much more of the opinion that you should do even better for those who are close to you.
So, for starters, Kristina and I are going to talk about ways to do even better work for those 5,291 of you who are Our People (the Die-Hard Fans, Boosters, and Regulars). That will likely start with some surveying. We’ll let these people, who already have an affinity for who we are and what we do, help us craft the future. If the other 77% like that, great. If not, meh.
We’ll also use it to segment more of our own marketing emails about our training programs.
What Do You Think? Will You Try This?
What do you think of the “Our People” or “Highly Engaged” metric of those who open your email newsletters at least half the time?
If you decide to try this analysis, let us know how it goes (especially if you have an Excel solution to share)!
You can comment here or email us.


